While we retain a generally long-term positive view for equities, especially for those companies more exposed to the re-opening of the economy or involved in domestic and global infrastructure projects, we feel the current momentum has reached a short-term high. Many indicators are a bit extended, and we would not be surprised if another correction like the one we experienced in February might develop soon.
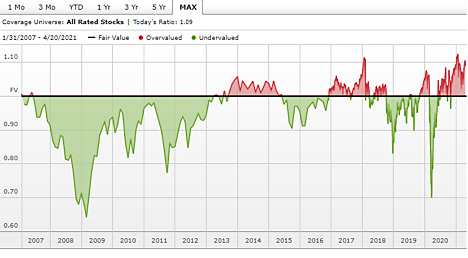
Besides the traditional valuation metrics such as P/E ratios of different variety which have been on the high side for a while and not very helpful in identifying peaks, we show two charts below that look at the valuation of markets from two distinctive perspective. The first chart compares the current market value to the intrinsic value of all stocks covered by Morningstar. Intrinsic value is calculated by Morningstar using a proprietary Discounted Cash Flow Model. The chart shows a level of overvaluation close to what we faced at the beginning of 2021 and 2018, right before two corrections.
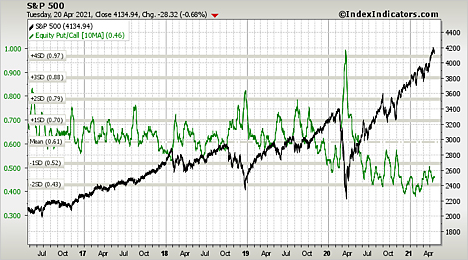
The second chart utilizes the volume ratio of puts and calls options as a way to identify perception of risk by investors. The ratio has a contrarian nature, and it is currently indicating that traders seem to be much more interested in any upside rather than protection for any possible downside move. The current level of complacency is statistically relevant and represents a cause for short-term prudence.


