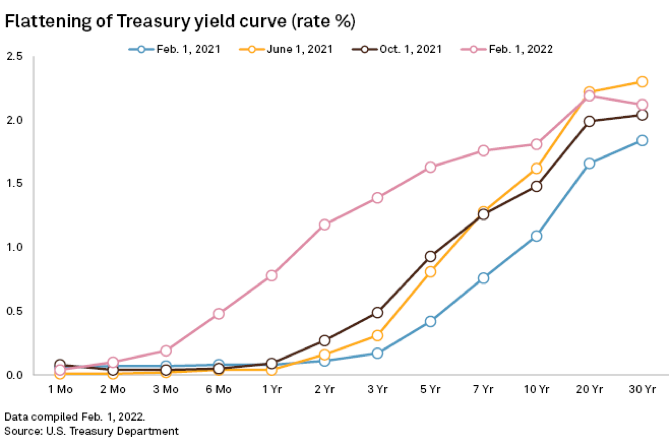
Recent economic numbers and reactive monetary policy discussions and decisions have had the effect of significantly flattening the yield curve.
The yield curve, or the term structure of interest rates, is a representation of the different yields offered by securities issued by the US Treasury for each maturity. The curve is generally expected to be upward sloping as one should be rewarded with a higher yield for the longer maturity. However, the steepness of the curve can change as expectations about economic activity, inflation, and perceived monetary responses are factored in by investors.
When expectations about future economic growth weaken, the yield on longer maturity bonds decreases faster than yields on securities with a short maturity, therefore the curve flattens. As of February 2nd, the spread between the five-year Treasury and the 30-year long bond was only 49 basis points, a very flat curve indeed and the smallest gap since January 2019.
An extremely flat curve comes dangerously close to a rare but significant event: a curve inversion. An inverted yield curve, or when a longer maturity bond yields less than a shorter maturity one, usually signals that a recession is coming. In the last 50 years, every recession has been preceded by an inversion of the curve, albeit not every inversion has actually been followed by an economic contraction. Nevertheless, the track record of this indicator is strong enough (and logical enough) to cause close monitoring.
Currently, the flat curve could be exaggerated by the still large Federal Reserve Quantitative Easing program which purchases long dated securities, but that policy is about to end, and it could result with a sudden steepening of the curve.
In conclusion, one strong support to equity prices, in spite of the current volatility, is the fact that investors believe a recession is a far and away event. Monitoring the yield curve should give us more information about the possible sequence of the economic cycle.