Yesterday around midday, news about an upcoming proposal by the Biden administration to increase taxes on capital gains hit the wires and pushed stocks down into the close. While, tax increases were clearly expected, it was the proposed size of the increase that took markets by surprise. However, it is important to provide context and historical comparisons to fully understand the potential impact of such a change on CGT (capital gains tax).
John Authers at Bloomberg provided a good analysis and some interesting charts on the topic. In the last CGT hike of 2012, the market slightly dipped at first, then churned for awhile before taking off again in 2013. If one looks at other CGT changes in history a pattern becomes apparent: slight dip and strong recovery. One other important element to transpire is the fact that CGT changes, while important, do not carry much weight when compared to other predominant macro-economic issues. For instance, in 2008 we started the year with a CGT cut and of course we ended with a brutal financial crisis that overtook all other contingencies.
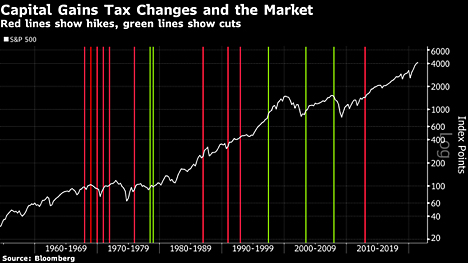
Authers provides an historical overview of CGT changes and S&P500 behavior in this chart:
The following chart, also provided by Authers, shows market action 6 months before CGT changes and 6 months after:
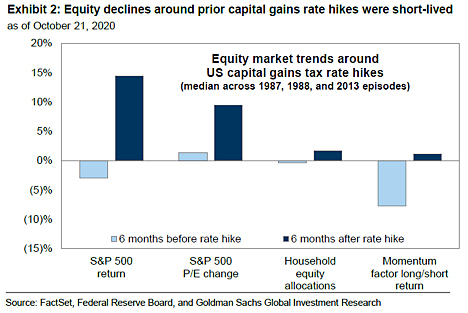
Momentum stocks seem the ones that may have currently more to loose (they do carry the highest potential capital gains) and from the above chart, it would seem they also carry the higher long-term ramifications.
Games are on and we will have to go through some grinding negotiations to see what the final CGT increase will be. This may induce more volatility into the end of year, but absent other macro-economic deterioration, it should be resolved relatively quickly.