In our blog we have previously mentioned liquidity flows and institutional rebalancing as one major source for this fast and furious rally from the March lows. The major liquidity injection of the Fed and the need to rebalance the equity-bonds allocation for pension funds and alike has been fuel to the fire. While the Fed does not seem to be getting tired (a fact telegraphed by a weakening US Dollar), institutional rebalancing has probably reached a temporary plateau.
This has been cause for caution on a short term basis especially in the face of the upcoming earning season. Unsurprisingly, the proportion of global fund managers who believe equities are overvalued is now the highest since 1998 (based on Bank of America’ s proprietary survey), as John Authers of Bloomberg reports.
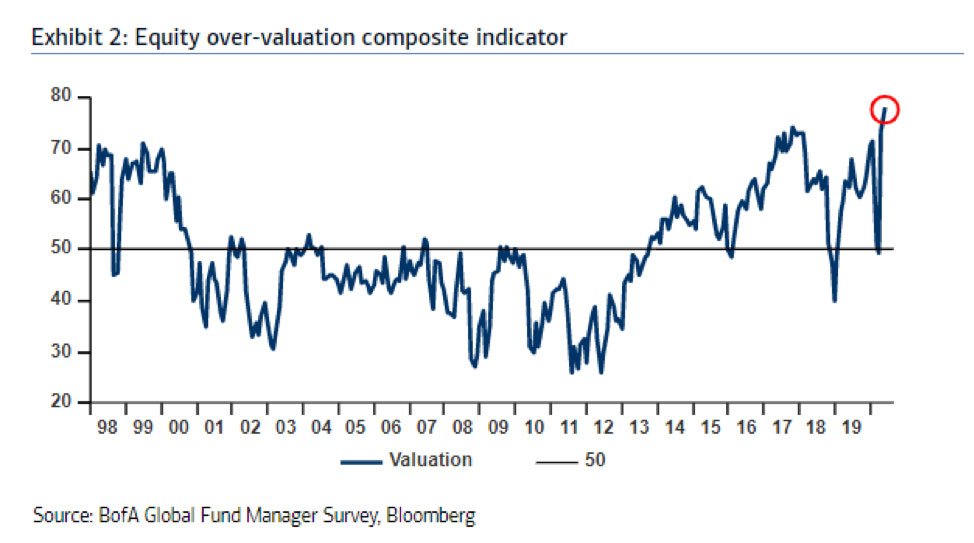
In the graph above, one can see that in previous peaks in the late 1990s and in 2017, it did not take the market too long to correct. However, this indicator is somewhat at odds with the percentage of investors’ exposure to equities. Deutsche Bank shows in the following graph that investors are still significantly on the sideline and that equity exposure is still at one of the lowest points in the last ten years.

A combination of the two charts seems to indicate that a correction might be in the cards, but downside pressure should find relatively quick support from underexposed investors.