As the market continues its bullish move off the lows of December 2018, we want to take the pulse of trading action and see if we can spot signs of exhaustion or additional momentum in the markets.
The earning season came in as expected and produced mostly good results even though a slowdown is probably in the offing as the tax cut tailwinds disappear and the friction on trade with China progresses. We also find ourselves toward the tail end of a seasonally strong period in trading, January, which is often followed by a pause in February.
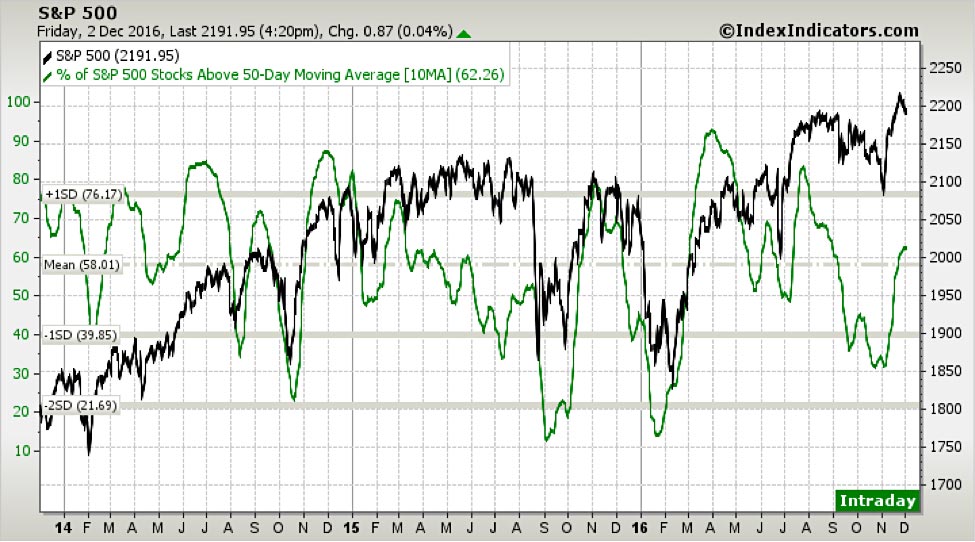
From a technical perspective, we are showing below three indicators that tend to give us fairly good signs of temporary overbought or oversold periods in the S&P 500. The first chart shows a measure of breadth defined as the percentage of stocks in the S&P 500 which is currently trading above the 50 day moving average. While a sustained bullish move requires an expanding breadth, peaks can be identified which are generally followed by corrections. The graph below shows that a smoothened average of such indicator is now getting close to being 2 standard deviations above its mean flashing an overbought condition.
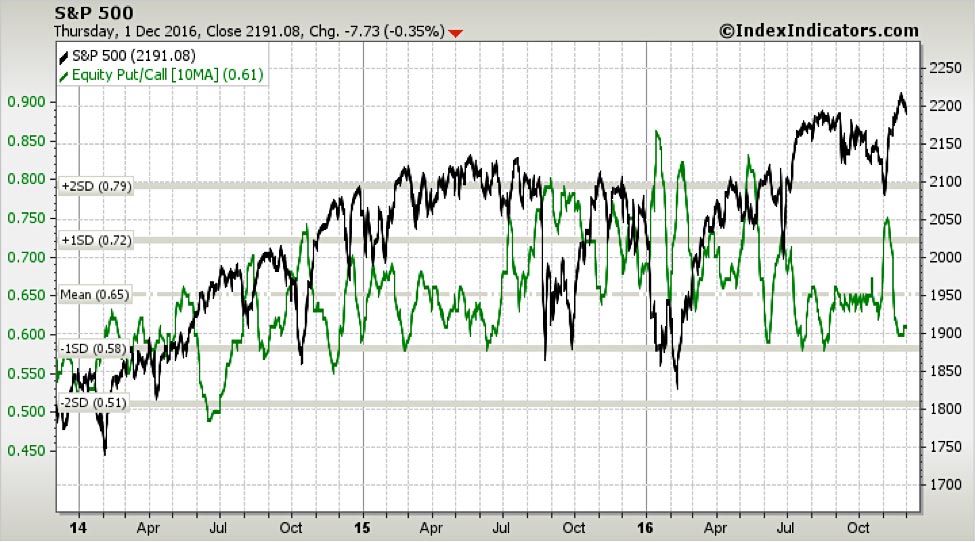
The second chart plots the equity put/call ratio which identifies periods of euphoria or panic as defined by options prices. A very high put call ratio indicates too much fear in the market and a ratio that is too low shows complacency. Currently we are 1 standard deviation below the mean. This is somewhat complacent but not yet at an alarming level.
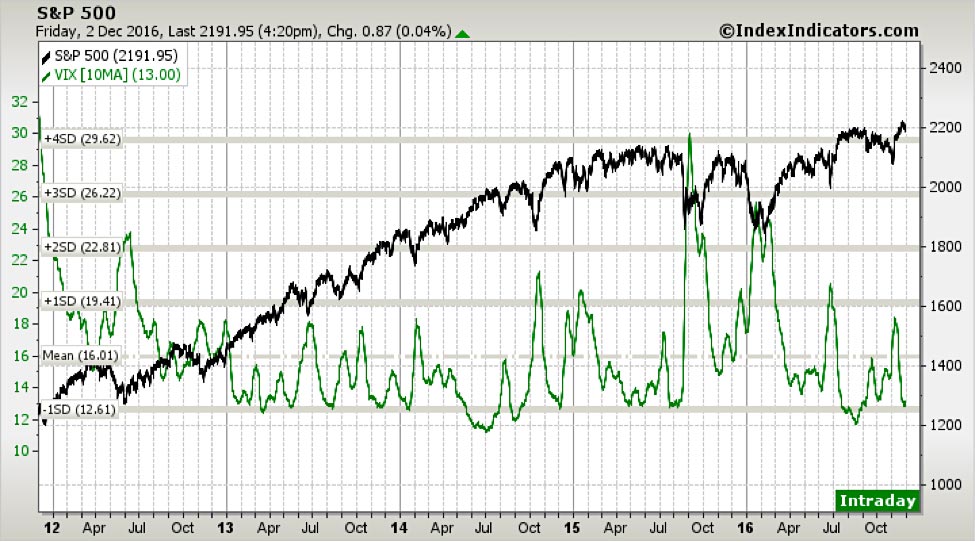
Our third chart is related to the previous one as it shows a smoothened moving average of the VIX, a volatility index based on options premia. This indicator, unsurprisingly, confirms the put/call reading.
In conclusion, from a technical perspective, we may have a little more room before a correction hits but not much. The next question is how deep of a correction should we expect. For now, our chips are on a shallow seasonal retracement that may provide a good trading opportunity. Fundamental changes may modify this vision as trade wars and domestic policy issues work their way through.
One interesting technical level to monitor as the retracement takes shape is the December 2018 low. Admittedly far from where we trade today, an undercutting of such level (2346 for the SPX) would most likely invalidate all bullish scenarios.